

Faster Claims. Cleaner Pipeline.
Insurance Revenue Cycle Case Study — Engagement Start: January 2025 | Prepared: September 2026
Scope of This Review
This case study covers the insurance side of the practice’s revenue cycle — claim submission, payer turnaround, and insurance-claim aging. Patient-responsibility billing is managed separately and isn’t included here. All figures are shown as percentages, ratios, or day counts; no dollar amounts are included.
Executive Summary
Since taking over the practice’s insurance claims management in January 2025, average claim turnaround has improved 32%, and the share of billed claims sitting unresolved has been cut nearly in half on a matched-period basis. Those gains have held through a year and a half of management, and today’s claims pipeline is dominated by fresh, still-processing balances rather than aged debt.
Results at a Glance
What the Engagement Delivered
32% Faster Claim Turnaround
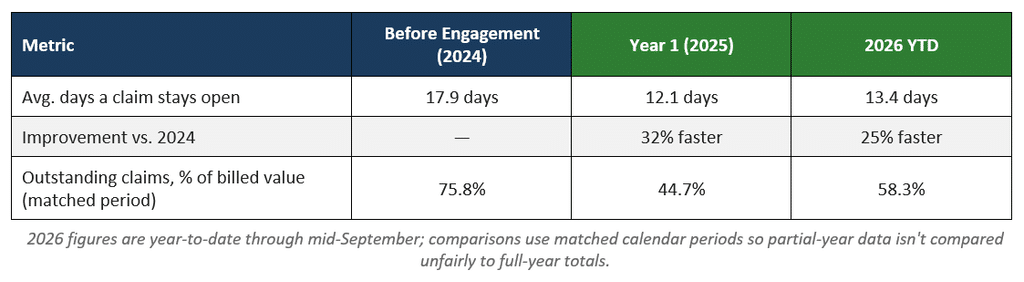
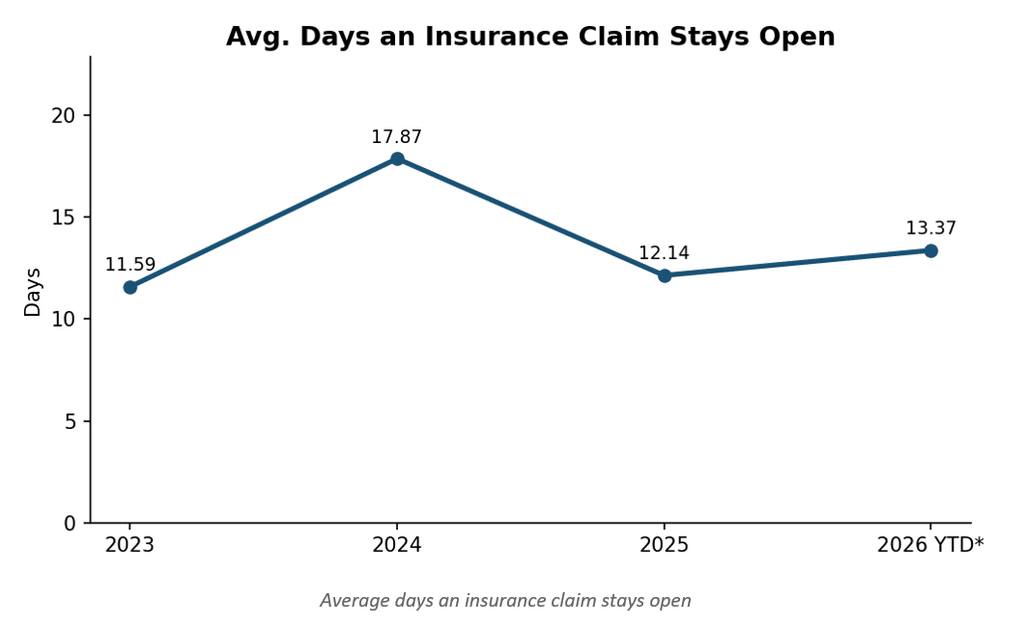
Average time a claim stays open dropped from 17.9 days to 12.1 days in the first year of management — a 32% improvement — and has held close to that level through 2026 (13.4 days, still 25% faster than the pre-engagement mark).
Outstanding Claims Cut Nearly in Half
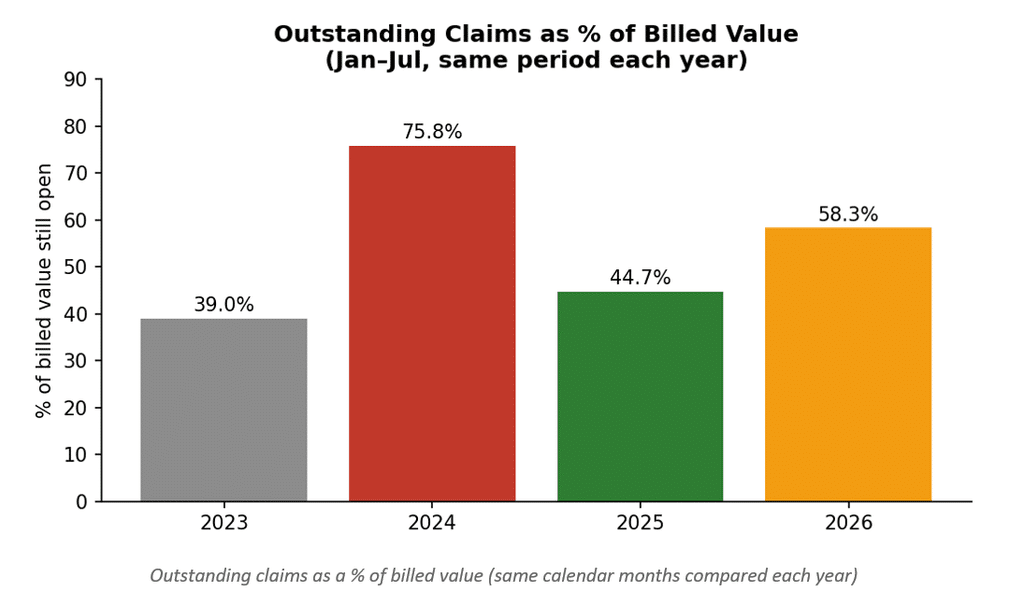
Measured on a matched-period basis (the same calendar months compared year over year, so the comparison isn’t distorted by partial-year data), the share of billed value still outstanding fell from 75.8% to 44.7% in the first year of management — and has stayed well below the pre-engagement level ever since.
A Cleaner, Current Pipeline Today
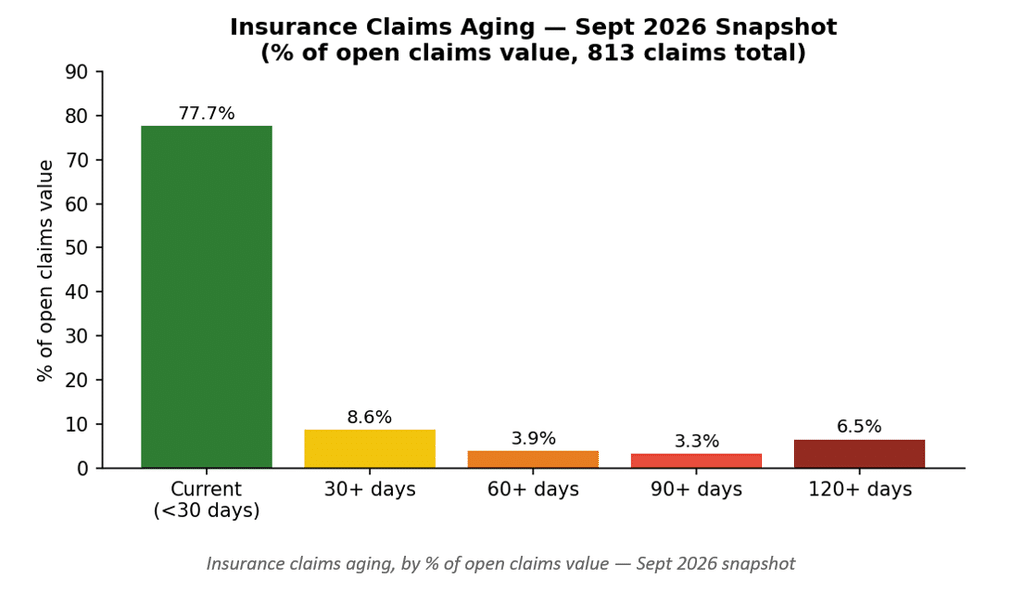
A payer-level snapshot from September 2026 shows the pipeline is healthy: of 813 open insurance claims, 77.7% of the outstanding value is still within the first 30 days — actively moving through normal adjudication rather than sitting aged. Only 22.3% has aged past 30 days.
Staying the Course Into 2026
These gains have carried into the second year of the engagement. Turnaround remains close to the improved 2025 pace, and while the matched-period outstanding-claims ratio (58.3%) is a metric we’re continuing to watch closely, it remains far below the 75.8% mark seen before the engagement began. As the remaining months of 2026 finish processing — the same pattern seen every prior year — we expect this figure to keep improving.
For additional context: the practice’s broader AR aging report (which combines insurance and patient balances) reflects a different point-in-time snapshot and includes patient-responsibility AR outside this engagement’s scope. The claims-pipeline data above is the more reliable indicator of current insurance-claim health.
Data Notes
- The pre-engagement dip in early-to-mid 2024 coincided with the industry-wide Change Healthcare clearinghouse outage (February 2024), which disrupted claims processing for a large share of U.S. providers for several weeks. The practice used Change Healthcare as its clearinghouse at the time. We can’t isolate from this data how much of 2024’s slower turnaround was attributable to that outage versus other factors, so it’s included here as relevant context rather than an explanation.
- This version presents metrics as percentages, ratios, or day counts rather than dollar figures.
- 2026 figures are year-to-date through September 16, 2026 (~71% of the calendar year). Matched calendar-month periods (Jan–Jul) were used across all years for fair comparison rather than comparing partial-year totals to full-year totals.
- The two most recent months of 2026 claims (August, September) were excluded from the outstanding-claims ratio because they haven’t had time to resolve yet — normal payer turnaround lag, not a performance issue.
- Total insurance payments collected declined each full year from 2023–2025 and are not included as a headline metric here, since that trend reflects overall billed volume as much as claims-handling performance.
Bottom Line
Since January 2025, the practice’s insurance revenue cycle has become measurably faster and cleaner: claim turnaround is down 32% from pre-engagement levels, the outstanding-claims share has been cut nearly in half, and today’s pipeline is dominated by fresh, still-processing balances rather than aged debt. These gains have held for a year and a half and continue into 2026.
